Updated: 1 October, 2025
5 October, 2024
The OWASP Software Assurance Maturity Model (SAMM) is rapidly becoming the go-to framework for application security programs, and it’s easy to see why. SAMM offers a structured, measurement-driven approach to improving product security. As a well-established framework since 2009, it helps organizations evaluate their software security maturity on a scale from 0 to 3. However, many organizations face challenges after completing their initial SAMM assessment. There’s growing interest in understanding how other organizations are progressing, making real-world data one of the hottest topics in the SAMM community. SAMM Benchmarking project aims to provide exactly that. During the past OWASP Global AppSec Conference in San Francisco the SAMM Core Team has shared the latest benchmark data. In this blog, we provide an in-depth analysis and interpretation of the OWASP SAMM Benchmark data.
Key takeaways
- Most of the currently limited benchmark data (30 assessments) is based on global multinational companies conducted by third-party assessors.
- The average SAMM score for all assessments is 1.44 out of 3.0. Based on my experience with SAMM and the community feedback that is a relatively high score. I doubt this score is representative especially for smaller firms.
- Overall large organizations are very strong on governance and operations, which is not surprising.
- Verification is the lowest scoring business function. Amongst the most interesting insights:
- We are investing quite some effort on security requirements, but we are not really dealing with them in any systematic way at the code level.
- We all complain about the amount of noise in our SAST tools, yet only a handful companies are tuning their security tooling.
- Surprisingly we are still struggling with meaningful metrics and KPIs. In other words, we are investing in application security, but we have no idea what the return on those investments is.
Benchmark demographics
The benchmark dataset is limited to 30 SAMM assessments
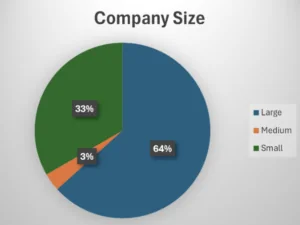
Let’s start with the really bad news first. There are only 30 submissions in the benchmarking dataset. Obviously, this number is very low and we cannot claim the data is representative for the whole world. The Benchmarking Project also aspires to provide data segmented by various parameters, such as geography, industry, company size, primary software development methodology, etc. In other words, imagine you are the application security responsible for a bank. You would be mostly interested in comparing your scores to another bank of roughly the same size and in the same geographic region. However we can afford that sort of granularity only in case we can guarantee k-anonymity. k-anonymity is a privacy-preserving technique that can guarantee that each individual’s data cannot be distinguished from at least k other individuals. The good news is that in the latest SAMM benchmark update we could afford to segment the data by company size.
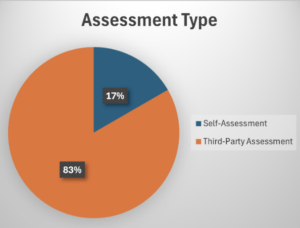
83% of the benchmark data is provided by expert third-party SAMM assessors
One of the greatest concerns for the benchmarking project is the quality of the data in the dataset. SAMM provides a list of quality criteria to help assessors interpret each activity in order to come up with an objective score. However based on our experience we know that assessors might interpret these differently. We have also noted that self-assessments are somewhat more positive (though not always). Hence, we assume that independent expert third-party SAMM practitioners are likely to provide more accurate data. Over 80% of the benchmark data is provided by reputable third-party SAMM assessors. Thus we can safely conclude at this point that the benchmark data is highly qualitative.
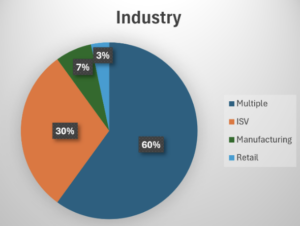
60% of the data is based on global multinational companies
I have spoken to many SAMM users and practitioners that are eager to donate their data to the benchmarking project. However often the legal and/or executive team is against it. This is why it is somewhat surprising that most of the data is coming from large multinational companies operating worldwide. We would expect smaller companies having easier time to convince their executive / legal teams to donate their data. While seeing the data for large multinationals is pretty impressive the majority of companies worldwide are small and medium.
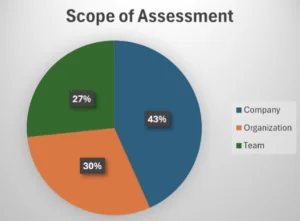
The assessment scope represents a balanced mix between teams, organizations and companies
In order to conduct a SAMM assessment you need to define the scope first. The scope could be a single team, the whole company or an organization that represents a unit of business within the company. The benchmark data is based on a balanced mix between the three assessment scope types. However currently I am not aware of any meaningful impact of the assessment scope on the results and their interpretation.
Overall benchmark results
Maturity levels
Before we jump into the scores let’s recap what the SAMM maturity levels mean.
- Maturity level 0 means nothing is going on in terms of application security for a given business function, practice, stream and/or activity.
- Maturity level 1 corresponds to an initial understanding and ad-hoc provision of the practice.
- Maturity level 2 is all about increasing efficiency and effectiveness of the practice.
- Maturity level 3 requires a comprehensive mastery of the practice at scale.
The maturity levels could help you put a qualitative label on the scores. However averaging maturity levels across difference practices is not always meaningful. For instance, consider 3 practices scoring 0.0, 3.0 and 3.0 respectively. Their average score would be 2.0, which indicates a pretty high maturity. However the impact of having a 0 score for a certain practice (e.g., secure build) could be substantial.
Nonetheless, averaging could help us give some meaning to the numbers. Furthermore, the closely related two concepts are the more meaningful the average becomes. E.g., averaging incident detection and incident response makes more sense than averaging governance and operations.
The average SAMM score is 1.44 out of 3.0
Is this a good score? Honestly, it is too good to be true. I strongly doubt if we pick 30 random companies their score will even get close to 1.0. This is also the reaction I hear from the community: “our relative score split across the business functions is similar, but the absolute scores are way lower than that”. That is especially true for smaller companies. The average score actually went up compared to the previous benchmark data set (with 25 data points).
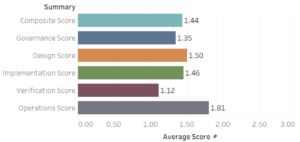
Operations business function is the highest scorer with 1.81 out of 3.0
Operations is the highest scoring business function where the maturity level is close to 2. This business function includes all activities needed to maintain the confidentiality, integrity, and availability of an application and its data throughout its operational life. This is not surprising at all. Large organizations represent the majority of the dataset. These organizations also have been traditionally investing and mastering the operations activities.
What is surprising though is that operations is also the highest scoring business function for small companies. Small companies do not have the resources especially when it comes to incident detection and response.
Design scores 1.5 out of 3.0
Design concerns the processes and activities related to how an organization defines goals and creates software within development projects. In simpler terms, think about the whole “shift left” paradigm. It is very surprising that design is the second highest scoring business function with a score of 1.5. Design comprises activities like threat modeling, application risk profiles, security requirements, reusable secure architecture, etc. Based on my experience these are not the typical activities companies traditionally invest in as it requires a huge effort. Here are some key insights based on my own experience.
- Large companies are typically scoring very high for vendor management stream.
- Large companies have rigorous Release Readiness Review checklists that serve as a great starting point for security requirements.
- Most companies have pretty strong technology management. In other words, it is relatively easy to achieve high scores for this stream in SAMM.
Combined with the averaging effect across small and large organizations the numbers could be about right. If we zoom in further into the data we actually see that Design is the third highest scoring activity for small companies.
Implementation scores 1.46 out of 3.0
Implementation is focused on the processes and activities related to how an organization builds and deploys software components and its related defects. The build and deploy are the traditional activities that comprise the whole DevOps / DevSecOps paradigm. Honestly, I would expect this business function to be amongst the highest scorers. Here are some more key insights that could further explain the scores:
- Companies rarely fail the build if vulnerable dependencies are found. Though in some contexts (e.g., waterfall process for developing firmware) making sure the build always passes is an explicit requirement.
- Only a few teams leverage a “nice list” for formally approved third party components.
- Signing the builds and verifying the signatures during deploy is a rarity.
Once again, drilling further into the data we see that for small companies implementation is actually the second highest scorer.
Governance scores 1.35 out of 3.0
Governance focuses on the processes and activities related to how an organization manages overall software development activities. More specifically, this includes concerns that impact cross-functional groups involved in development, as well as business processes established at the organization level. The list of factors to consider here:
- Large companies are known to have strong governance practices especially when it comes to policies, standards and regulatory compliance requirements.
- Training and awareness is also gaining quite some popularity especially in the large enterprises.
- Small companies are more likely to have a lot of tribal knowledge and unlikely to invest in procedures. The same logic holds for activities like security champions program and centralized knowledge bases.
This is one of the business functions where we would expect the results to be very extreme for large (very high score) vs small (very low score) enterprises. Our expectations are unequivocally confirmed by the more detailed data.
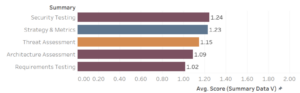
Verification is the lowest scoring business function with 1.12 out of 3.0
Verification is about making sure that we are doing the right things right. This business function typically includes quality assurance work such as testing as well as review and evaluation activities.
This business function is consistently the lowest scorer independent of any other factors like company size for instance. The low scores for verification are both expected and surprising. At the highest level of abstraction it is odd that companies are not really verifying they are doing a “good enough job”. This business function also comprises activities that are becoming more pervasive, such as penetration testing and security tooling. However a number of activities in this business function is often perceived as complex. Others require long-term and strategic investments in application security with unclear short-term return-on-investment. Here are some more qualitative insights into the data:
- Two out of 6 streams in verification are largely part of threat modeling which still is an esoteric art at many companies.
- Although security tooling is now pervasive companies rarely tune their tools. This is critical to ensure that the number of false positives remains low. It is also essential to improve your tooling based on new findings.
- Organizations invest in security requirements, but rarely systematically verify those with unit and integration tests.
- We are still not getting the maximum out of pen tests. Ideally, pen test results should end up in improved training, tuned security tooling and end up in security regression test suites.
Overall I strongly believe that threat modeling is the key to a systematic application security program improvements. Unfortunately it is often misunderstood as an activity that requires a huge time-investment in order to train and run the threat modeling sessions. In reality, pragmatic threat modeling is neither time-consuming nor expensive. Threat modeling can also help your team learn “how to fish” instead of simply “giving them the fish”.
Other interesting findings
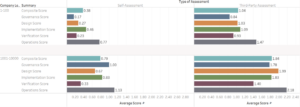
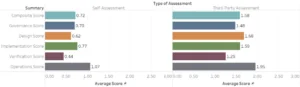
Third-party assessments are consistently scoring substantially higher than self-assessments
It is quite surprising to note that third-party assessments are scoring consistently higher than self-assessments. The expectations of SAMM veterans were that self-assessments would suffer from giving oneself more credit due to a shallow interpretation of the quality criteria. We also thought that people would be eager to score higher and give themselves more credit than they deserve. All of that might have still played some role, but the numbers don’t match the simplistic expectations. What else is there?
One of the reasons to explain these numbers backed up by my own experience is that no matter what you communicate as an assessor teams perceive SAMM assessments as audits. Hence, they actually prepare for the assessment. The real question is if it is possible to increase your SAMM score substantially within a relatively limited time-frame (e.g., 2 months). The answer is (as always) it depends.
For some activities you could increase your maturity within a reasonable timeframe
Not all SAMM activities are equally hard to implement. There are activities that could be improved relatively easily depending of course on your organization’s realities. Here are some examples based on my own experience within a small organization: secure build and deploy, centralized defect tracking, secrets management, security testing. Many of these require adopting tools and tuning them. So in theory, if you expect a third party to run an assessment at your organization you could start improving some activities.
You could inflate your SAMM score relatively fast
For a number of practices inflating your SAMM score without the actual work is relatively easy, especially if your current maturity score is very low. I will only provide 1 example as this idea is in general terrible. Consider for instance training. If your current score is 0, you could come up with a set of courses that would cover the quality criteria. You could also update your corporate policies to require a training for everyone onboarding. In theory, you could increase your score from 0 to 2 in a matter of weeks. There are other tactics to inflate your SAMM scores. That is obviously however not the goal.
Note: If you are looking to inflate your SAMM scores you should consider obtaining a compliance certification.
Third-party assessments are likely to be follow-ups
One other factor to consider backed by my own experience is that a third-party assessment could be a follow-up. More concretely, the team has done a self-assessment. They have actually planed and done the work of improving their security posture. After that they have decided to call in external experts to further make sure they are on the right track.
Companies are struggling with meaningful metrics and KPIs
SAMM says that organizations should leverage metrics to measure the effectiveness of the application security program. Furthermore, metrics should be accurate and inexpensive to gather. Many organizations are leveraging metrics and KPIs. A typical metric and KPI are based on vulnerability metrics produced by various SAST, DAST and SCA tools. KPIs are based on number of high and critical findings. Typical SLAs are about making sure that a certain fix time is guaranteed per criticality category (e.g., high findings should be solved within 30 days). These metrics are indeed consistently measured and easy to gather. However whether they are good to measure the efficiency of the AppSec program remains questionable at best. Here are the main reasons for that:
- Tool vendors want to make sure they flag all possible vulnerabilities. Hence, by design, tools are likely to produce a lot of false positives.
- Tools also don’t know the context in which a system operates. They can estimate the impact based on CVSS2 scores that has taken quite some criticism. However impact scores are a poor proxy for risk. Indeed, we the likelihood for the vulnerability exploitation.
- Tools cannot find certain classes of vulnerabilities, such as insecure design.
A great metric should be a direct proxy for the return on investment on security and its impact on reducing the actual risk.
Organizations rarely verify the correct implementation of security requirements
Here is how software engineering works in a nutshell:
- Specify the requirements.
- Implement the requirements.
- Verify the requirements are correctly implemented.
A brief intermezzo about verification. There are different strategies to verify the requirements are correctly implemented. Manual tests is all about the QA going through the requirements one by one. Often teams also have a Release Readiness Review (RRR) document that specifies all the requirements that have to be tested before every release. Needless to say this is the slowest strategy on a long-term as you have to run the tests manually upon every single release. Acceptance (or end-to-end) tests are typically an automated version of what is on the RRR. They are often implemented by QA teams as well. Integration and unit tests are implemented by the developers and these are nearly always require a whole lot less effort. So the cost curve is not linear.
Security requirements should be treated as just requirements. Hence, we should try to implement as many security requirements using unit and integration test cases. However companies rarely end up doing that. I gave several presentations on this topic during the OWASP Global AppSec conferences. Feel free to also browse through my blog on security requirements-driven development.
Threat modeling still has a long way to go
Companies are not great at threat modeling, which is hardly surprising. Threat modeling remains an esoteric science despite in reality being relatively simple. Especially the pragmatic forms of threat modeling require neither much budget nor time. They do require leadership buy-in though, which in my opinion is perhaps the greatest obstacle to mainstream.
Companies have a lot of default security tools (SAST, DAST, SCA) they are not tuning
Security tooling is essential for the success of your application security program. However it won’t get there by itself. Vendors make their tools to try to produce as many findings as possible by design. They do not do that to scare you with thousands of vulnerabilities to you keep on paying for their tool. They want to make sure they don’t miss anything real. Hence, tuning the tools with your application’s context is a must (maturity level 2 in SAMM for scalable baseline stream in security testing practice). Here are some tips on tooling-related best practices:
- Before buying a tool spend some time analyzing how well it works for your tech stack. Ensure the tool is easily and highly customizable. The latter includes updating individual rules rather than just turning them on and off.
- After introducing a tool make sure to continuously configure the tool to reduce the number of false positives rather than just flagging the individual findings as false positive.
- Try to incorporate any manual findings (e.g., as a result of a manual review or a penetration testing) in the tools to ensure you never regress to the vulnerable patterns.
Companies do not like to prevent the build if there are vulnerable dependencies
SAMM Secure Build practice at maturity level 3 requires failing the build if any vulnerabilities or vulnerable dependencies are found. Once you have a build pipeline in place that integrates some security tooling this is relatively straightforward to implement. Yet companies are not really doing this. The main reason for that is that when dealing with third party components it is not always simple to replace an older and vulnerable version of a component with a more recent one. A component upgrade could have a snowball effect and require rewriting parts of the application.
Note that SAMM allows an explicit risk acceptance as a strategy, though as it seems that strategy is rarely used.
Secrets management is scoring great thanks to best-practice solutions
In its simplest form, best practices in secrets management require moving production secrets from repositories and configuration files into adequately managed digital vaults. A positive news from the OWASP SAMM Benchmark data is that organizations are doing a great job when it comes to handling secrets. We are convinced that best practices supported by modern cloud providers has substantially helped with getting there. Secret scanning is also becoming a commodity in the modern security tools. Hence, it is common to have organizations to disallow secrets in the committed code that is enforced by these tools.
Configuration hardening is rarely monitored by tooling
Many technologies in an application stack are not inherently secure by default. This is often intentional to improve backward compatibility or simplify the setup process. Configuration hardening is about consistent application of secure baseline configurations to all components. Although companies often score relatively good for configuration hardening there is rarely any monitoring and enforcement by tooling. Here are some further insights based on my own experiences:
- Container image scanning typically produces a huge number of findings. Fixing this findings is sometimes impossible as the base container image is the latest available version.
- “Golden images” require quite some time-investment both to bake them and to enforce everyone to use them.
- Some teams I have interviewed are actually trying to delegate this responsibility to the cloud providers. Some cloud providers actually do provide CIS benchmark monitoring services.
Data catalog is still a rarity despite increase in compliance regulations
There is actually not much to add to this headline. We’ve seen teams that are very strict about having a data catalog in place despite the fact that they do not process any sensitive nor personal data. Many teams seem to be not very strict about keeping a data catalog.